Why technology spend drifts away from outcomes
Spend drift rarely starts with a big mistake. It starts with approvals that feel reasonable in the moment. A new tool, a small integration, an urgent request, a renewal you do not want to fight.
Over time you end up with growing cost and unclear impact. Teams stay busy, leaders stay uncertain, and finance sees the curve go up without a matching story. This is one reason leadership teams also benefit from stronger fractional leadership discipline in the first 90 days.
- Approvals happen at the tool level. “We need this platform” replaces “We need this outcome.”
- Ownership gets split. IT owns delivery, the business owns adoption, finance owns the budget.
- Pilots never exit. You keep paying for experiments with no graduation criteria.
- Metrics are lagging. You only measure after the budget year ends.
- Renewals auto-renew. Vendor cost grows faster than value.
A practical spend to outcomes framework you can run every month
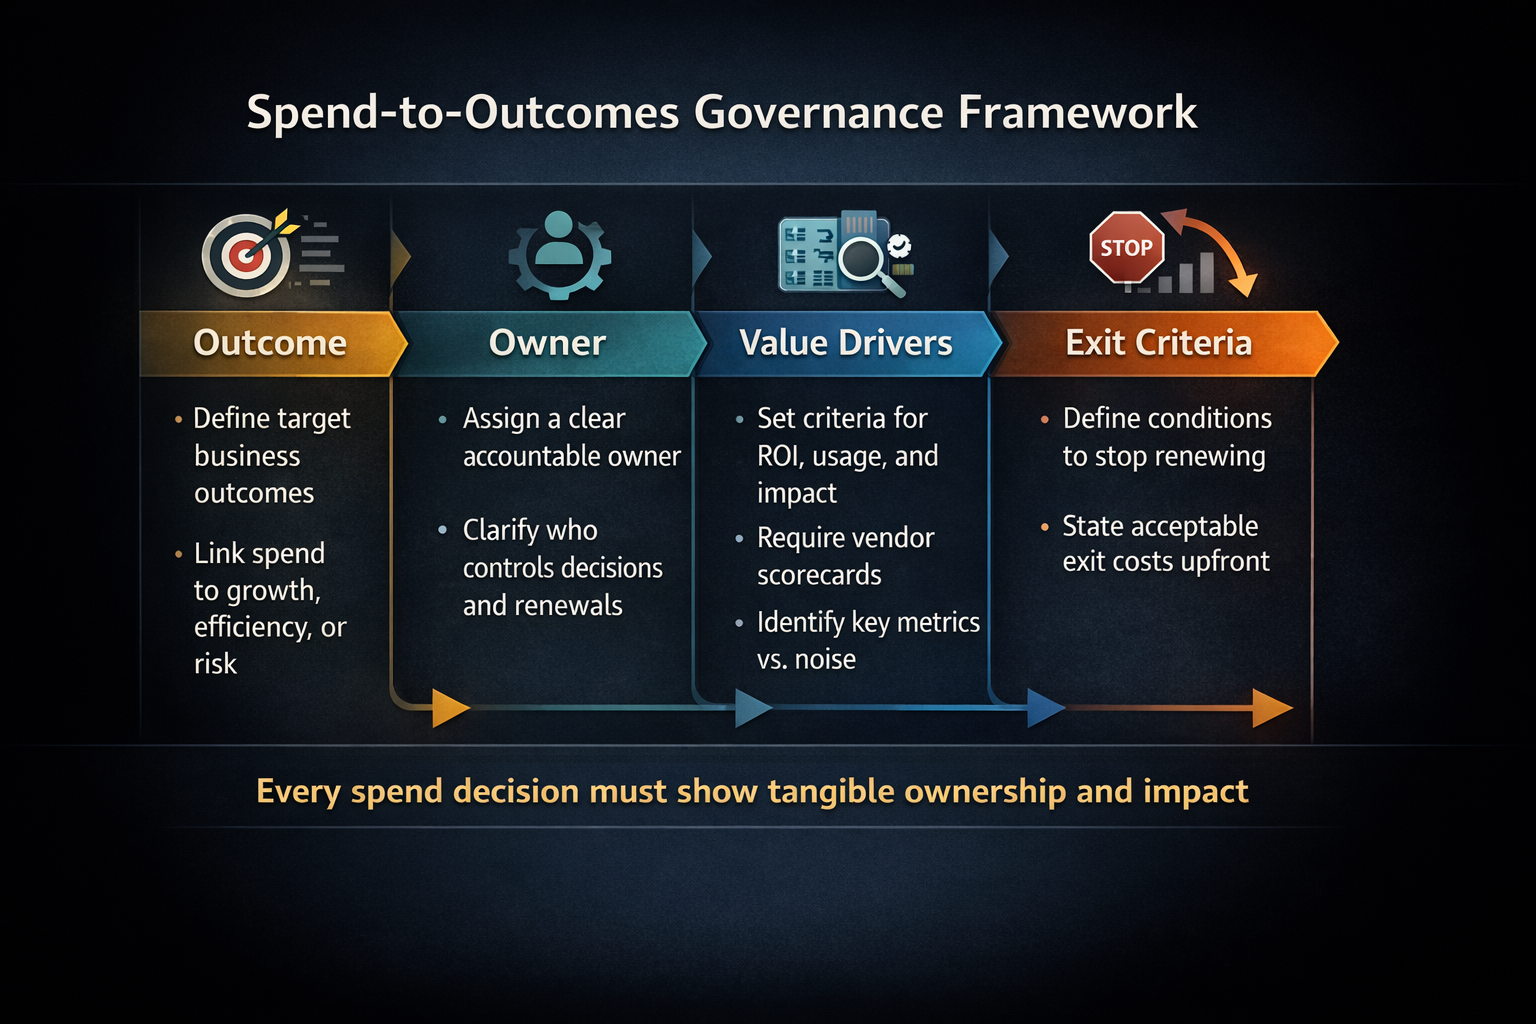
Step 1. State the outcome in one sentence
- Write the outcome as a measurable result and timeframe.
- Example. Reduce invoice processing time from 7 days to 2 days by end of Q2.
- Avoid activity language such as “improve automation.”
Step 2. Name the business owner and the metric owner
- Business owner. Responsible for achieving the outcome.
- Metric owner. Responsible for reporting the metric consistently.
- Delivery owner. Responsible for shipping and maintaining the work.
Step 3. Define leading indicators
- Lagging indicators show results after the fact.
- Leading indicators show progress week to week.
- Examples. Adoption rate, cycle time, error rate, ticket volume.
Step 4. Score the initiative
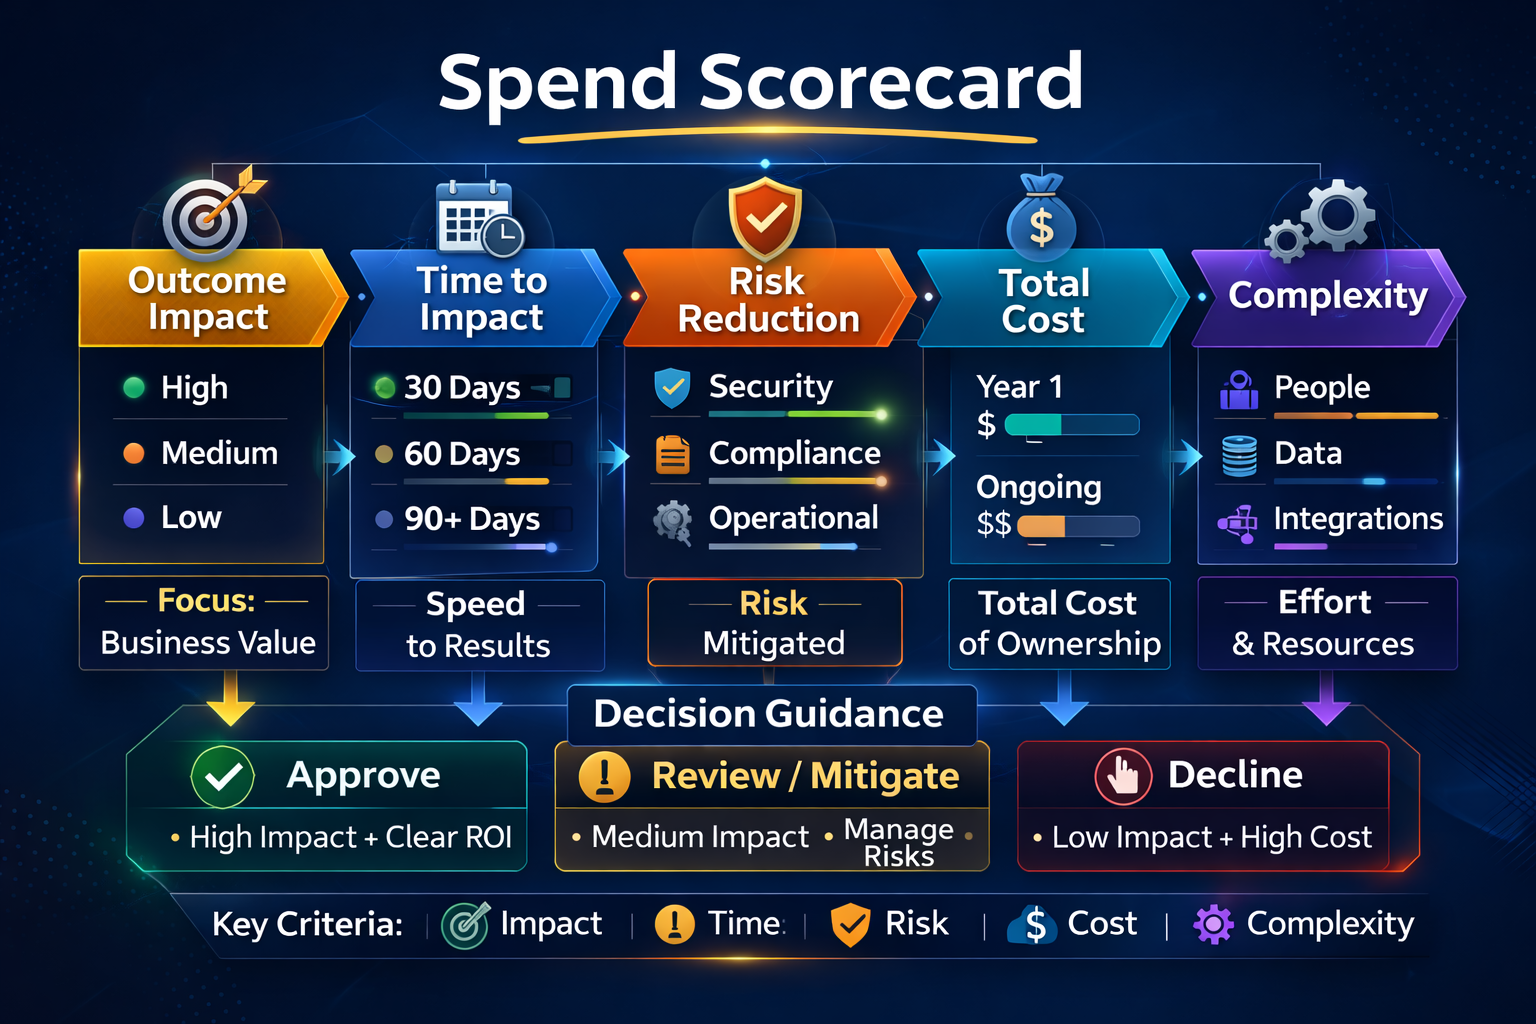
- Outcome impact. High, medium, low.
- Time to impact. 30, 60, or 90 days.
- Risk reduction. Security, compliance, operational.
- Total cost. Year one and ongoing.
- Complexity. Integrations, data, people.
Step 5. Define exit criteria
- Pilots have adoption thresholds.
- Leading indicators must move within two iterations.
- If metrics stall, reset scope or stop the initiative.
Budget guardrails leaders should enforce
Guardrails matter most when budgets tighten, vendors push renewals, or teams want to expand tools before results are proven. This is also where leaders should connect spend review to broader vendor governance discipline and operational accountability.
Pilot guardrails
- Every pilot has an owner, metric, and deadline.
- Pilots have capped monthly spend.
- Pilots must have a defined production path.
Renewal guardrails
- No auto-renew without a current outcome statement.
- Renewals require adoption and usage evidence.
- Overlapping tools require consolidation plans.
Tool sprawl guardrails
- One primary platform per capability.
- Exceptions require an outcome and sunset plan.
- New tools must prove value within 90 days.
A leadership cadence that keeps spend aligned
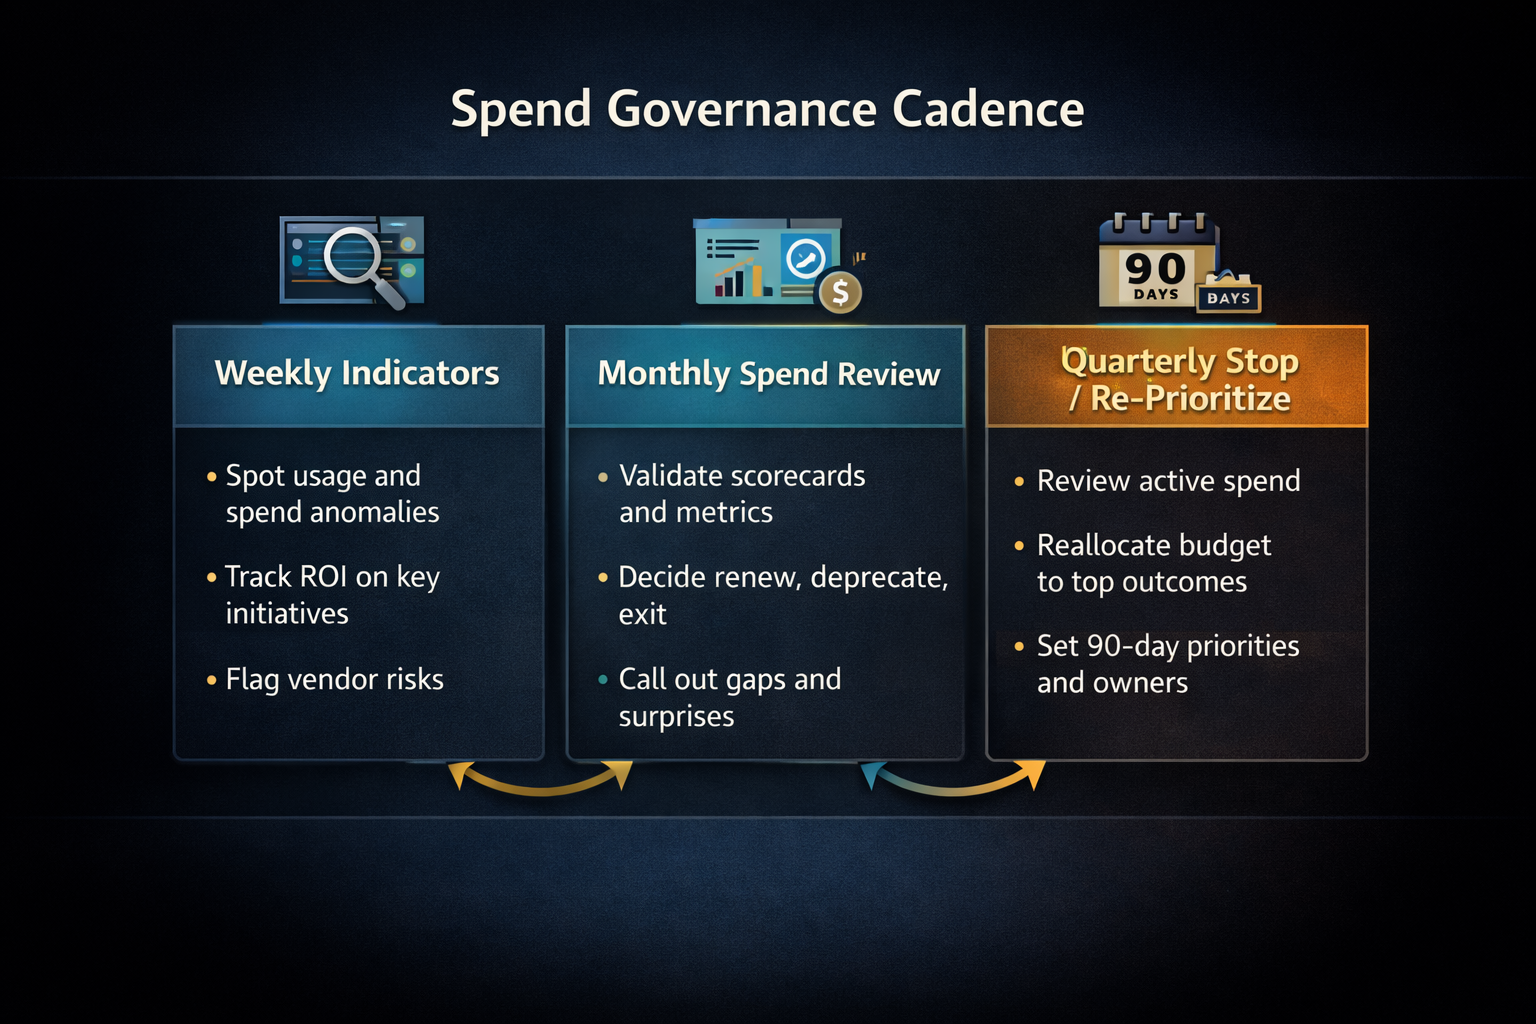
- Weekly. Review leading indicators.
- Monthly. Review outcomes and spend.
- Quarterly. Re-rank initiatives and stop funding low impact work.
This cadence works best when it sits beside the same planning rhythm used for execution planning, not as a finance-only exercise.
Quick answers for executives managing spend
- Approve outcomes, not tools. A tool request without an outcome is a cost request, not a business case.
- Make ownership explicit. One business owner and one metric owner prevent drift.
- Use guardrails early. Pilots, renewals, and overlap need rules before spend grows.
- Cadence keeps spend honest. Weekly and monthly reviews surface drift before it becomes margin leakage.
Frequently Asked Questions
What does it mean to align spend to business outcomes?
Aligned spend means every line item maps to a measurable outcome with a named owner, a decision path, and a metric reviewed on a fixed cadence.
What is the fastest way to find spend drift?
Start with what is already funded. Inventory active initiatives and recurring renewals, then require an outcome statement, a leading indicator, and exit criteria for each.
Who should own the metric for an outcome?
Assign one metric owner for each metric definition and data source. The business owner owns adoption and operational change. The metric owner owns consistent reporting. The delivery owner owns the system change.
How do you stop funding work without creating disruption?
Use exit criteria set before approval. When the leading indicator does not move after two iterations, stop expansion and either reset scope or retire the initiative while protecting production and compliance work first.
How should leaders handle renewals to prevent spend creep?
Review renewals 120 to 180 days early. Confirm adoption evidence, total cost drivers, and overlap with other tools. Require an updated outcome statement and a consolidation plan when overlap exists.
Want technology spend tied to measurable outcomes?
A short working session will surface spend drift, challenge vendor renewals, and create a leadership cadence that keeps investments aligned with outcomes.
Book a consultation